Understanding Climate Change
A website that uses D3.js to visually analyze climate change data. Data visualizations include line charts and stacked area charts of global climate change data, as well as a detailed choropleth map and other visualizations of Canadian weather data.
Type
D3.js Website
Year
2020
Skills Applied
- Front-End
- Web Development
- JavaScript
- D3.js
- HTML
- CSS
- Project Management
Team
- Robert Michels
- Radu Orlandea
The Task
As an exercise of interactive data visualization techniques, we planned to comprehensively visualize climate change data. Our goal was to condense complex datasets into simple charts that communicate the mechanics, origins, and local impact of climate change in Canada. To entice users, we would develop simple interactions such as pop-up tooltips, as well as complex interactions such as brushing, changing representations, and animation.


The Result
Understanding Climate Change
Features four color-coded line charts of global CO2 emissions and atmospheric concentration, as well as a stacked area chart of CO2 emissions by region.
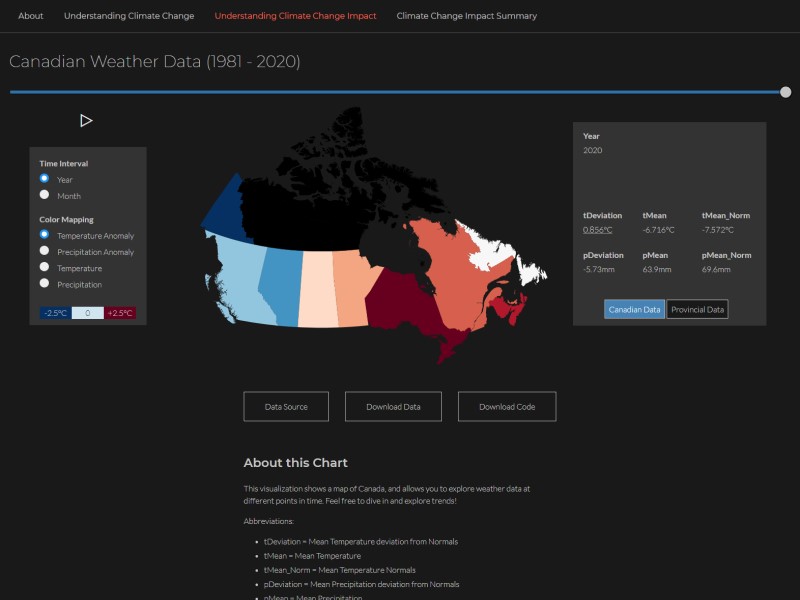
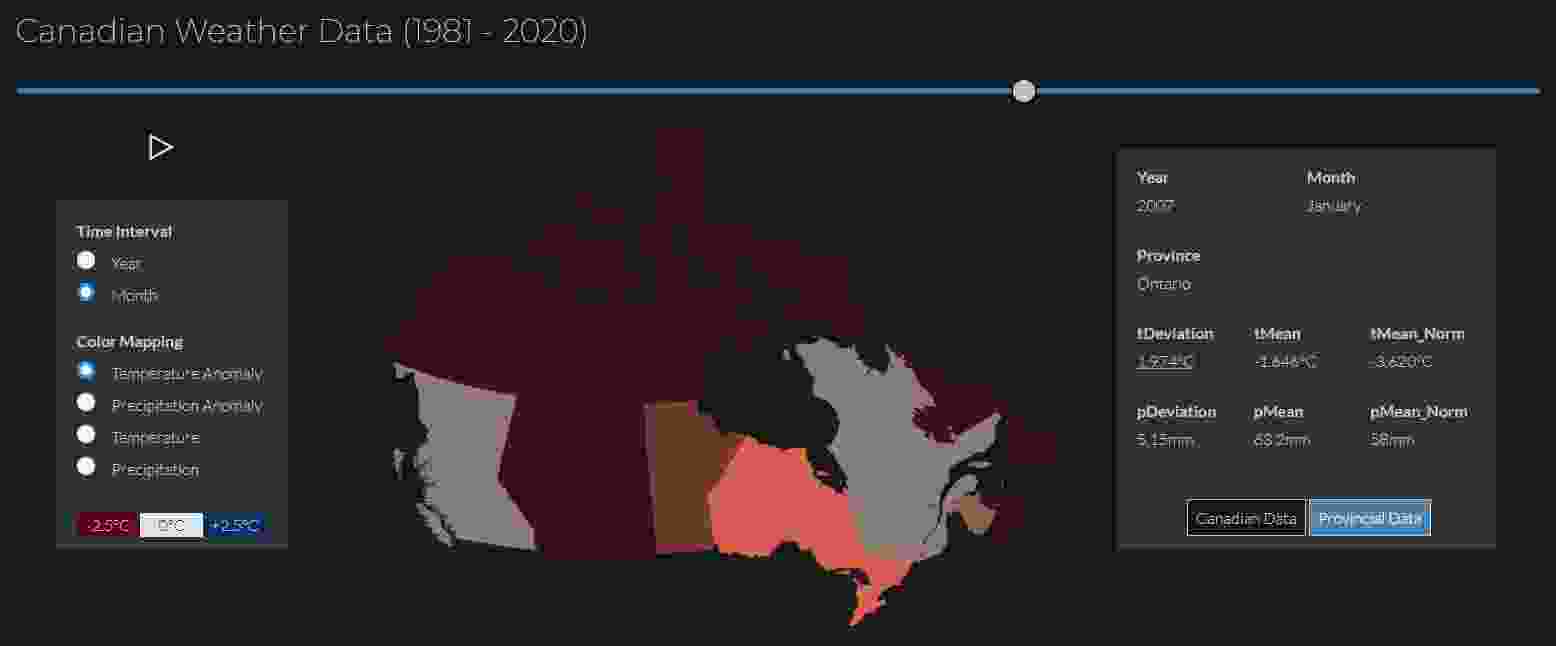
Understanding Climate Change Impact
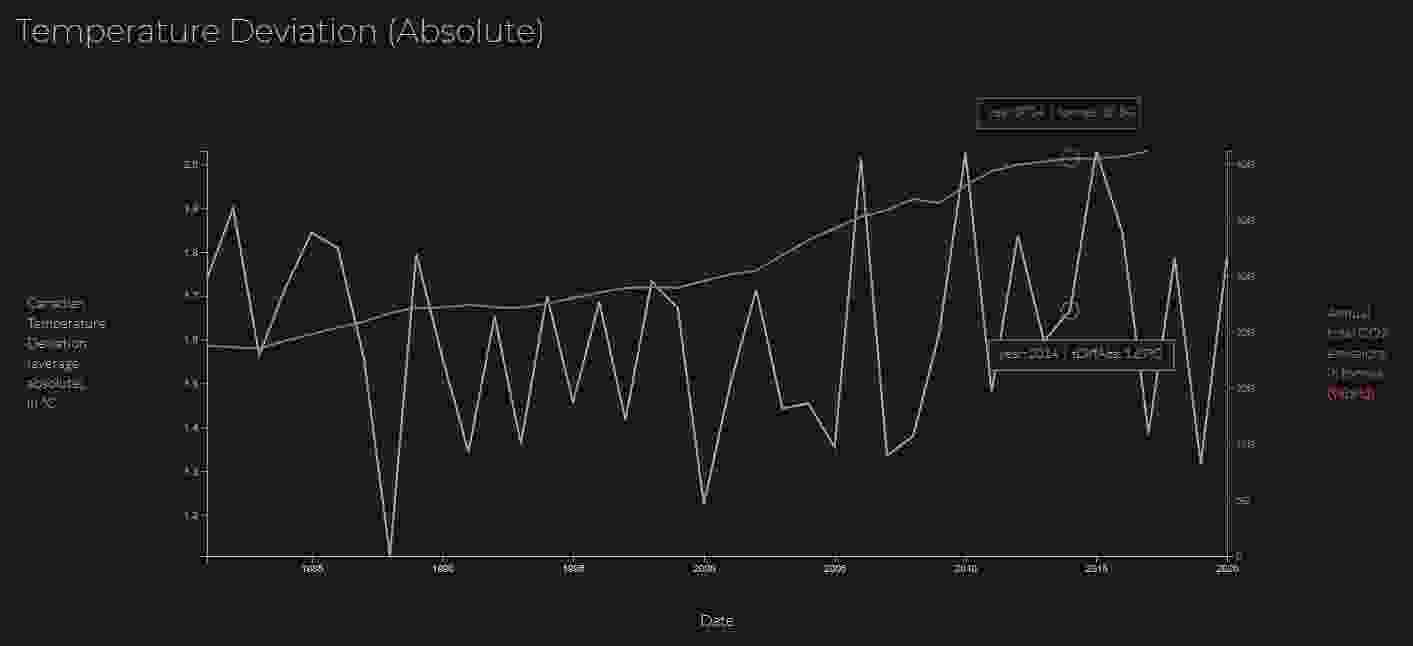
With the choropleth map of Canada and its provinces and territories, users can explore Canadian weather data, including temperature and precipitation, by year, month and province. There is also a spider chart of the global temperature anomaly over time. Both charts can be dynamically queried and animated.
Climate Change Impact Summary
The climate change summary charts aim to show a correlation, or lack thereof, of CO2 emissions and weather anomalies. There are four line plots of mean Canadian weather temperature, precipitation, and their anomalies, grouped with a line plot of global CO2 emissions.

Process
We developed the project in a team of two, over the course of two months, and it was our first experience with D3.js. Early on, we defined two central questions that we would attempt to answer with the project:
- What are the contributing factors to climate change?
- Since climate impacts weather, are there indications of Canadian weather behaving abnormally?
After defining these questions, we set out to find relevant data. Most data needed to be cleaned for outliers and bad data. The most complex dataset was that of Canadian weather data, as we needed to manually merge multiple large datasets, clean and sort the data, and calculate monthly and annual averages.
The final phase of project development involved developing the D3.js driven visualizations and assembling the final website, which also doubles as a project report. Most charts, including the line charts and stacked area chart, were fairly straightforward to implement. By far the most complex chart was the choropleth map of Canadian weather data. While the visual mapping of data to geography and color was challenging, the outcome was worth it. The resulting map provides an enticing and interactive way to quickly browse through a large dataset of Canadian weather data, and make local as well as federal-level observations.
The Code
The project is developed with HTML, CSS and JS, where we employ the data-driven visualization library D3.js. Implementing all the visualizations was very challenging, as D3 was new to us. Particularly the use of the chain syntax was cumbersome in the beginning. The general workflow consists of loading data, selecting DOM elements and inserting SVG elements with certain attributes mapped to the data. In the excerpt below, the Canadian Weather Data Chart is rendered in drawMap(), with the color of each province mapped to temperature or percipitation data depending on the user's inputs. The excerpt also includes mouse hover interactions for the individual provinces starting at line 58, where the province is visually highlighted and data in the legend is updated by calling updateDataData(), which isn't show in the example.